


An insight on how to apply design-thinking to build no-nonsense effective data visualization dashboards.
Do you see anything on top of the wood?
- OWL
- Moth
- It’s just wood

observe this wood image
Your brain just tried hard to make sense of a million pixels, trying to see a pattern that is familiar & can be recognized.
Does data really have to be so hard to understand?
No.
Design-thinking helps us present data in a way that is easy to interpret, analyze & recall.
In this article, we will cover how to apply design thinking to build effective data visualization dashboards.
#1 Data Is Everywhere!
Data data everywhere, but not a byte to think.
During the COVID-19 pandemic, Google searches & COVID news showed data of the increasing number of cases, severity by geography. Our lives & daily routines were largely dependent on daily news & data-heavy maps.
Covid-19 data tracker
Below are a few apps from my iPhone, some of them I use frequently every day – that is full of data.
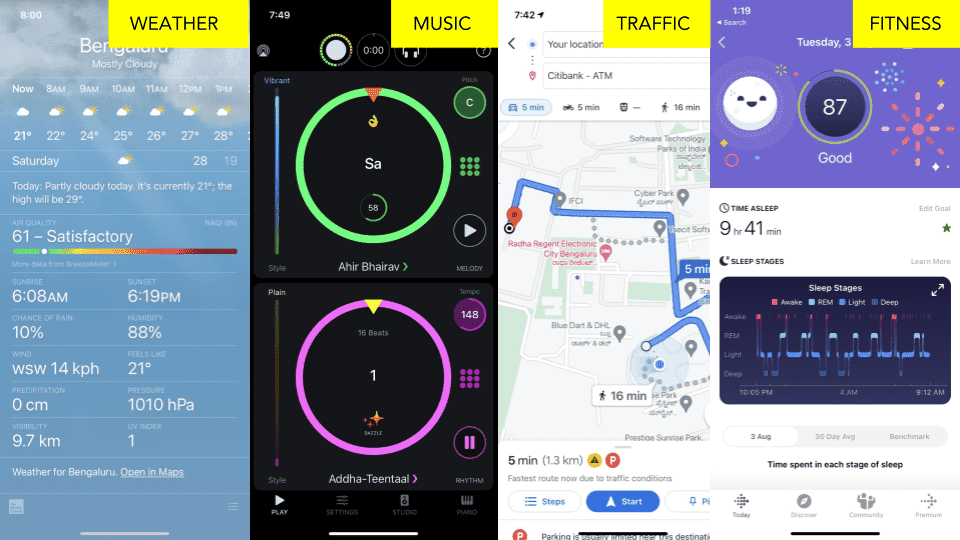
Shocking volume of data, collected every day & the cognitive load (mental overwhelm) it creates, has hit an all-time high. This demands – Simplicity, Relevance & Clarity.
Do you know how much data we create every minute?
156 million emails sent.
4,146,600 YouTube videos watched.
990,000 Tinder swipes done.
154,200 Skype calls done.
510,000 comments posted.
Literally, zillions of user events, 3+ Quintillion bytes Generated every day,
Data never sleeps.
#2 Our Brain & Biases.

Spotlight bias.
Confirmation bias.
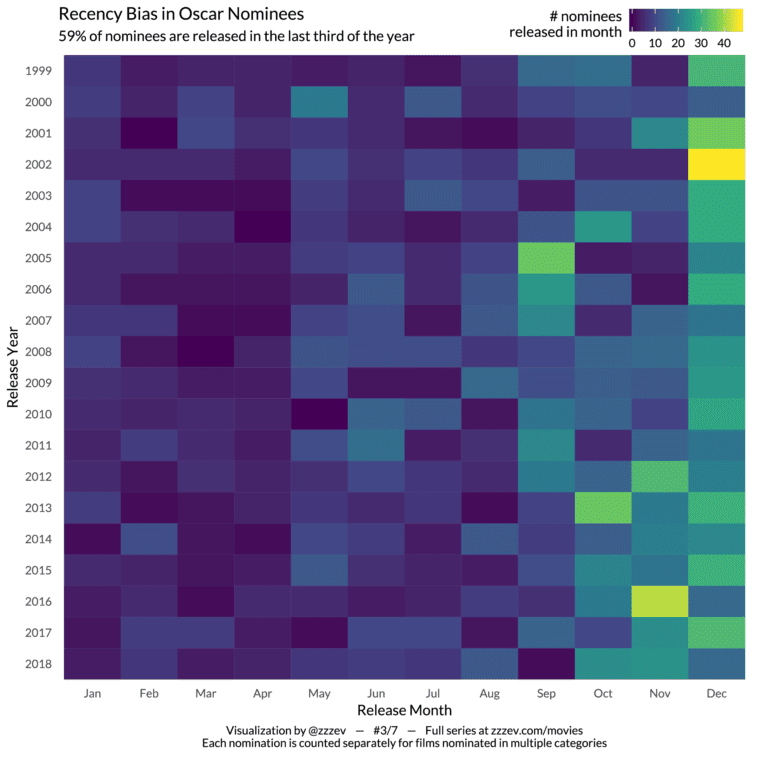
Recency bias.
& 250+ biases.
Affects our perception & choices every day.
How does our brain process information?
- We tend to skip data that’s hard to understand, calling it as “less helpful”
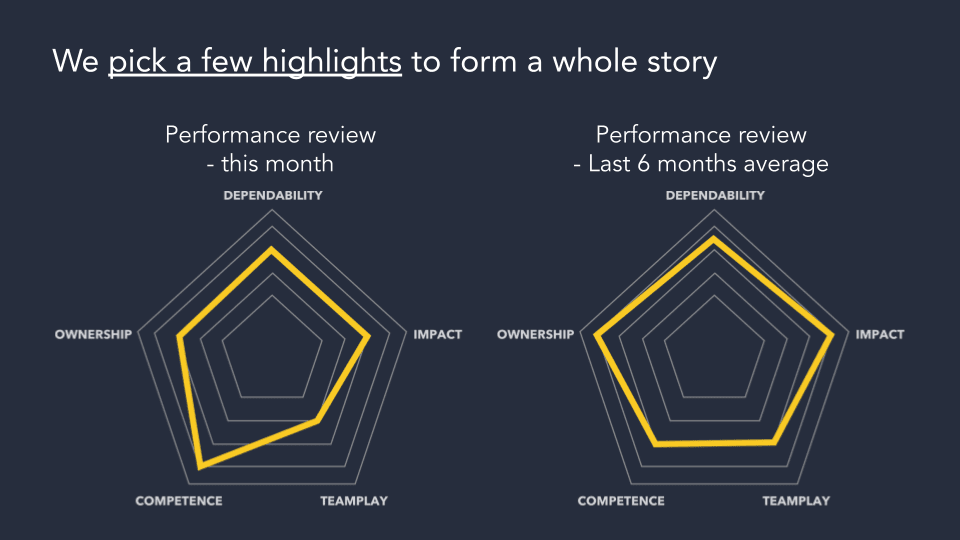
- We tend to pick a few highlights to form a whole story
- We tend to spot a risk from the first piece of data that stands out
- We tend to look for recent trends, vivid in our memory
- We tend to connect random events than sequential events
And we see what we want to see.
We find data that’s hard to understand as less helpful.
Simplicity makes a chart appear
more reliable & lowers the resistance to engage with it. Complication repels people.
Half-yearly performance review in teams – is an example of recency biases clouding judgements & decisions.
#3 Data Visualization Is Broken.
Data visualization is broken, at many levels.
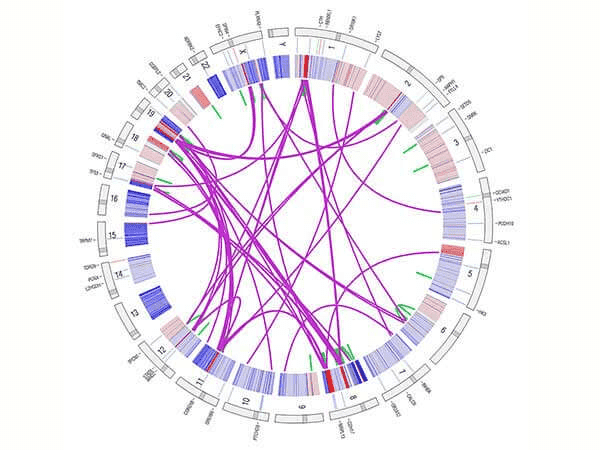
Here’s the first one: Death by detail.
Now we know why “Death to pie chart” became viral.
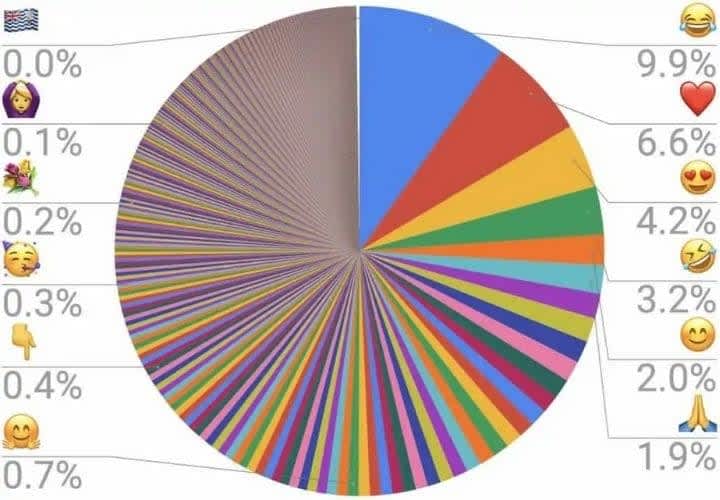
Avoid information overkill & obsessive detail. Simplify the visual, provide a link to dive into details – where relevant and useful.
Another one: A 3D chart which is 3D for no reason.
We don’t know why people use 3D graphs when numbers can be plotted on a 2D X-Y axis.
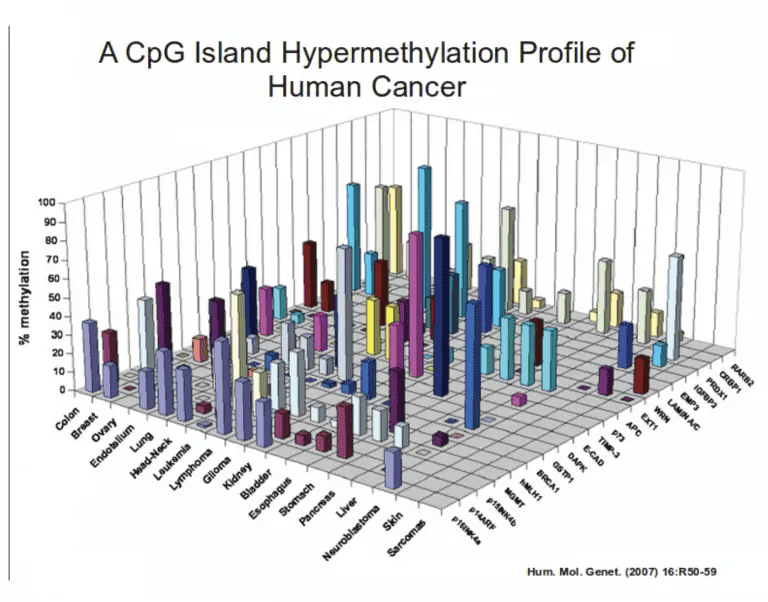
A 3D graph makes sense when more dimensions of information are needed to be conveyed, in the same graph. This can make the graph overloaded with a depth of information. An alternative is to have multiple graphs – instead of overloading one.
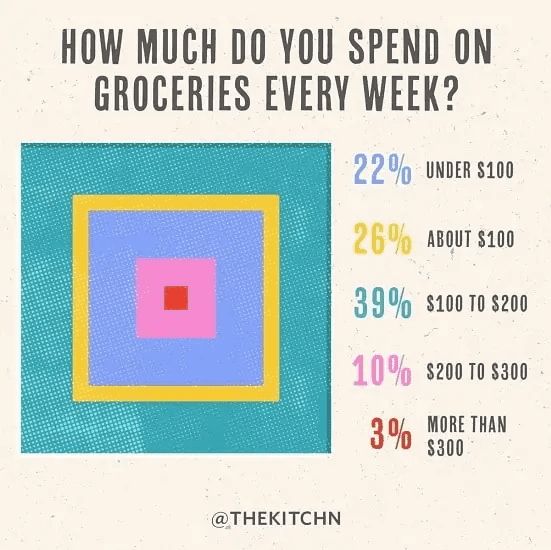
Another one: Complicating what can be simple.
Picking the right chart – the simplest one is often the hardest job to do. It’s a sin to complicate, confuse & then clarify.
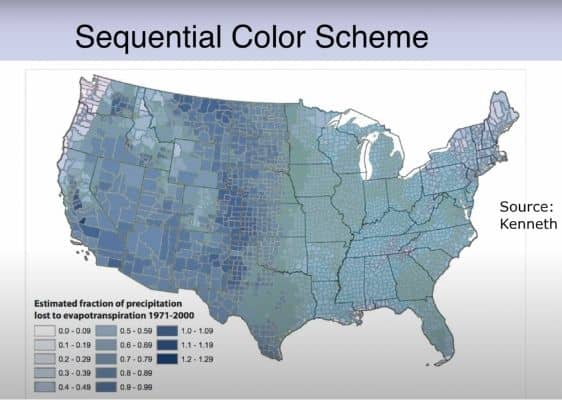
Another one: Using solid colors Vs gradients.
Take a look at the chart below. We found it painful to correlate colors to what they mean. And I was intrigued about a large part of the continent being yellow, my attention was all over the place & I wasn’t able to focus on an area that needed immediate attention.
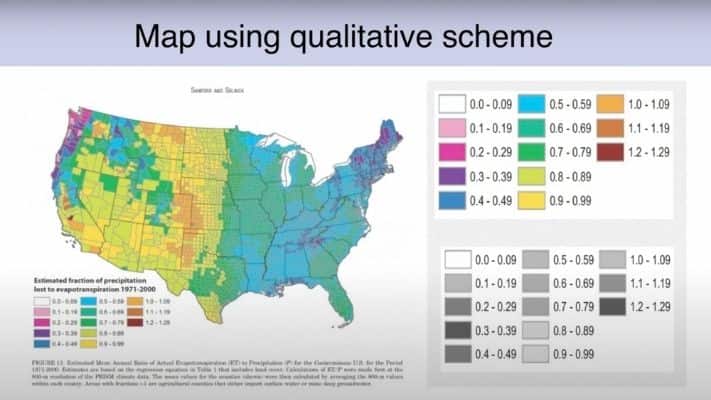
Now look at the same chart, with gradient colors – conveying the degree of impact/severity, with shades of grey – light to dark. This pushes me to pay attention to the darker areas, which need to be addressed first.
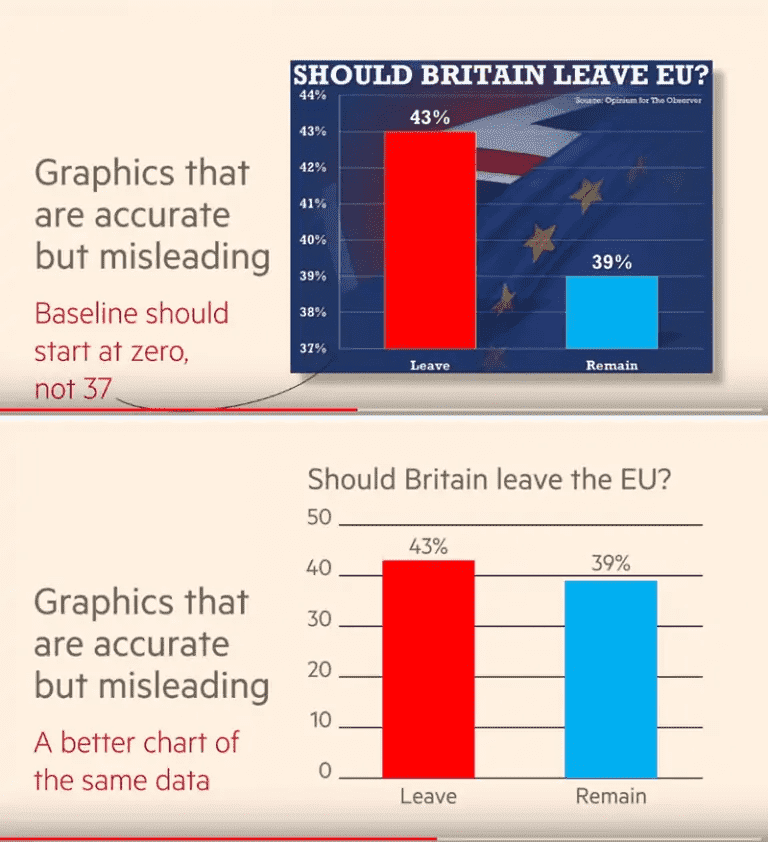
Another one: Be vigilant of tricksters.
Messing with scales & axes can trick the viewer into believing the first visual of information than actual facts.
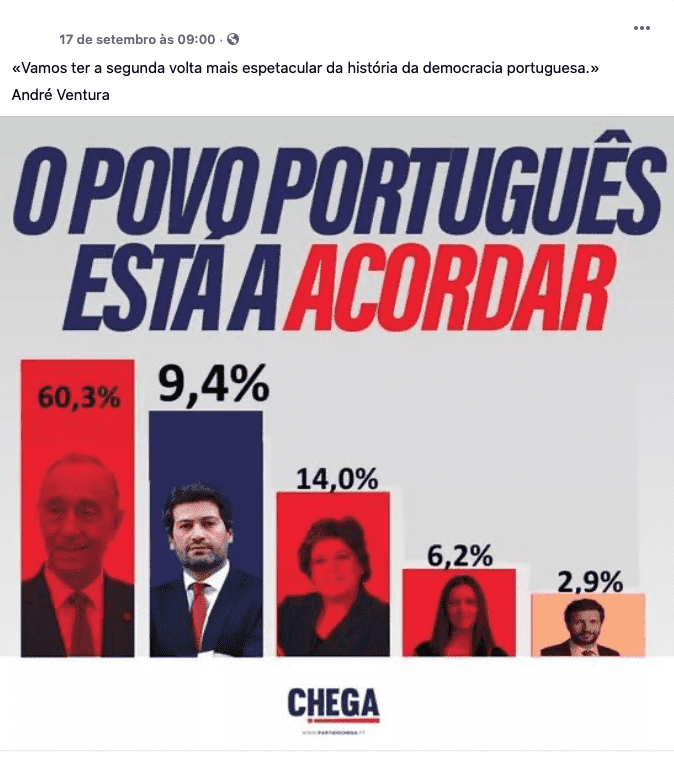
Absurd visualization:
Portuguese presidential elections, one of many absurd visualizations by right-wing candidate André Ventura.
#4 Start With Why: Design Thinking
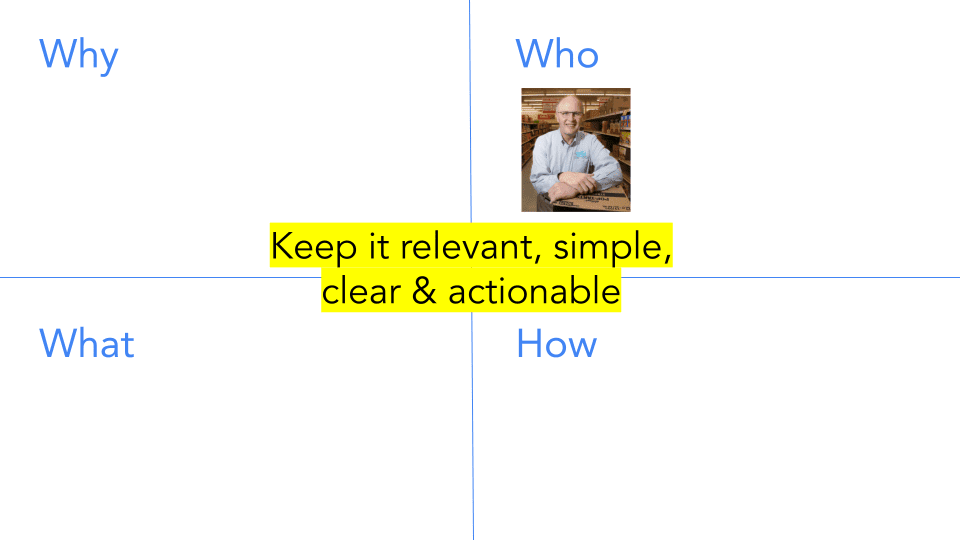
Design thinking is our favorite technique – of finding an intersection between what the user wants and what the business wants. Here are some questions we ask, before starting to build or fix data visualization apps.
- Who is the end user?
- What do they want to know from the data?
- What does the business want to do with the data?
- What is the simplest form of seeing the data people want?
- What is the minimal dashboard needed for clarity on decisions & actions?
- How does the user’s needs & business’s needs evolve over time?
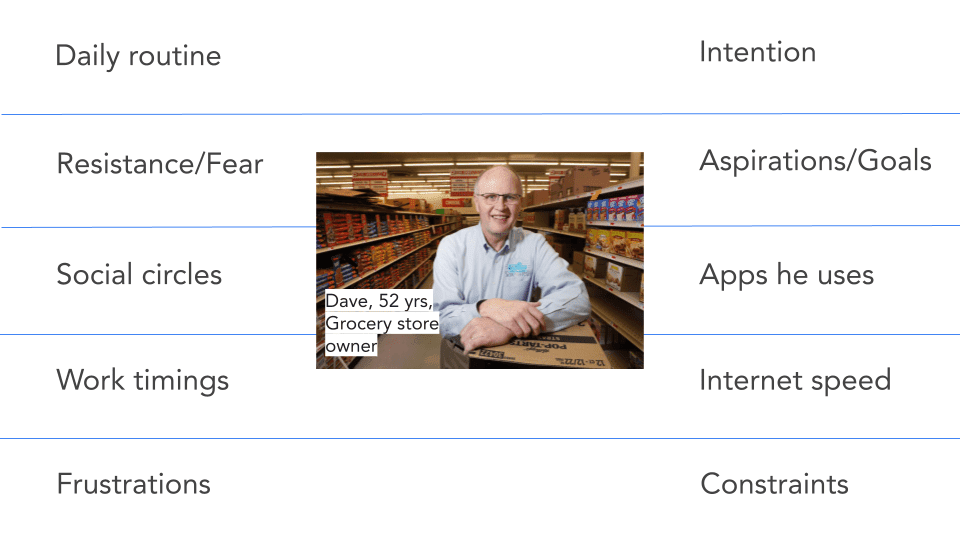
Knowing whom we’re designing for – helps us ask personality-revealing questions, that give insights on the user’s motivations & resistances.
To summarize:
Here are 5 steps for applying design-thinking to keep things simple & clear, for the end-user:
- Know who the user is, behind what meets the eyes
- Understand user’s intent & what he/she feels accountable for
- Understand what will their business stand to lose, if they don’t simplify data visualization for this user.
- Create a quick prototype of a Dashboard & Data visualizations. Observe how users react when they first see it. Observe what they’re able to understand quickly.
- Iteratively evolve & simplify the data visualization app, to adapt to changing needs of people & businesses
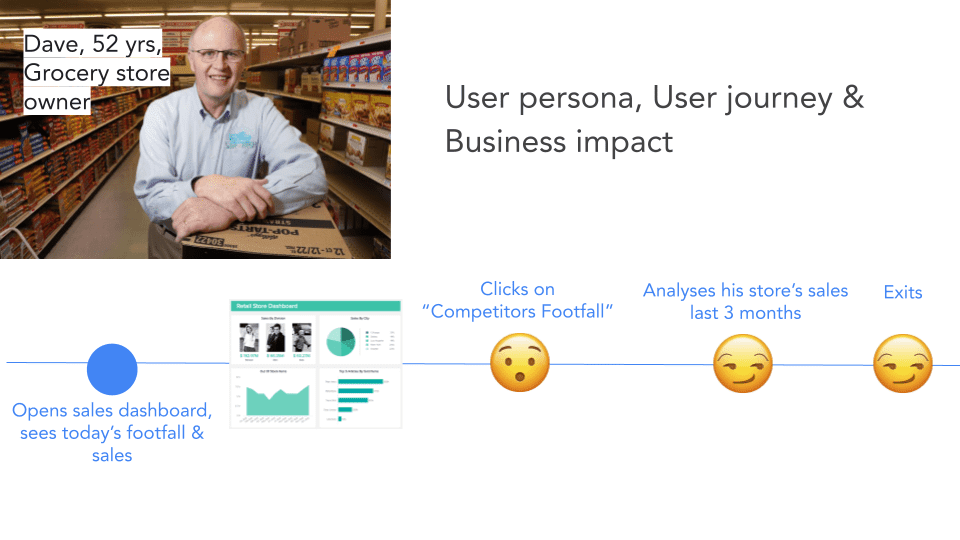
User persona, user journey, and business impact
#5 Aging World, Weakening Senses & Multi-sensorial Design.
The world is aging fast, we’re going to have a much larger population above 35 years by 2050. It’s becoming increasingly important that the technologies we build today stay usable even after 30 years from now, with faster aging bodies (especially sense organs).
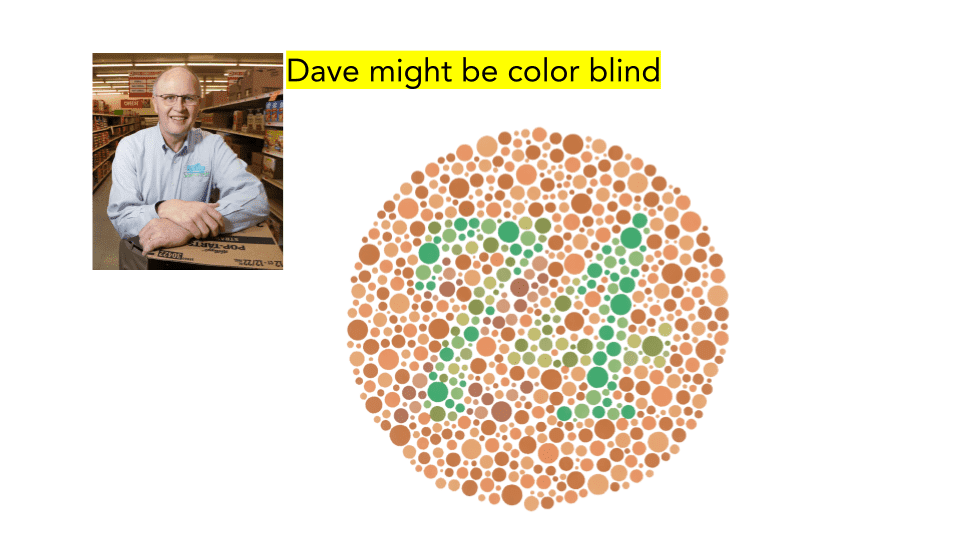
A holistic approach to defining user persona
Should the web app, Dave uses be full of colored graphs & charts? Or can we exploit sound/audio to deliver information?
Here’s how a data sorting sounds: https://www.youtube.com/watch?v=kPRA0W1kECg
Multi-sensorial design approach – pushes us to explore other ways of delivering data apart from the visual design. For example, we could convey the severity of an incident, by the sound of a siren, until users get alerted & take action.
#6 Data – The Source Of Truth & Ethics.
Ensure – Radical Truth, Radical Transparency, Radical Responsibility.
If you’re building data visualization tools & applications, to support decision making – ensure your systems are robust, secure, compliant & reliable, your data infrastructure protects the privacy of people, your storage systems are secure & safe, and your team is taking accountability to hold a single source of truth, maintain transparency & take responsibility for the consequences.
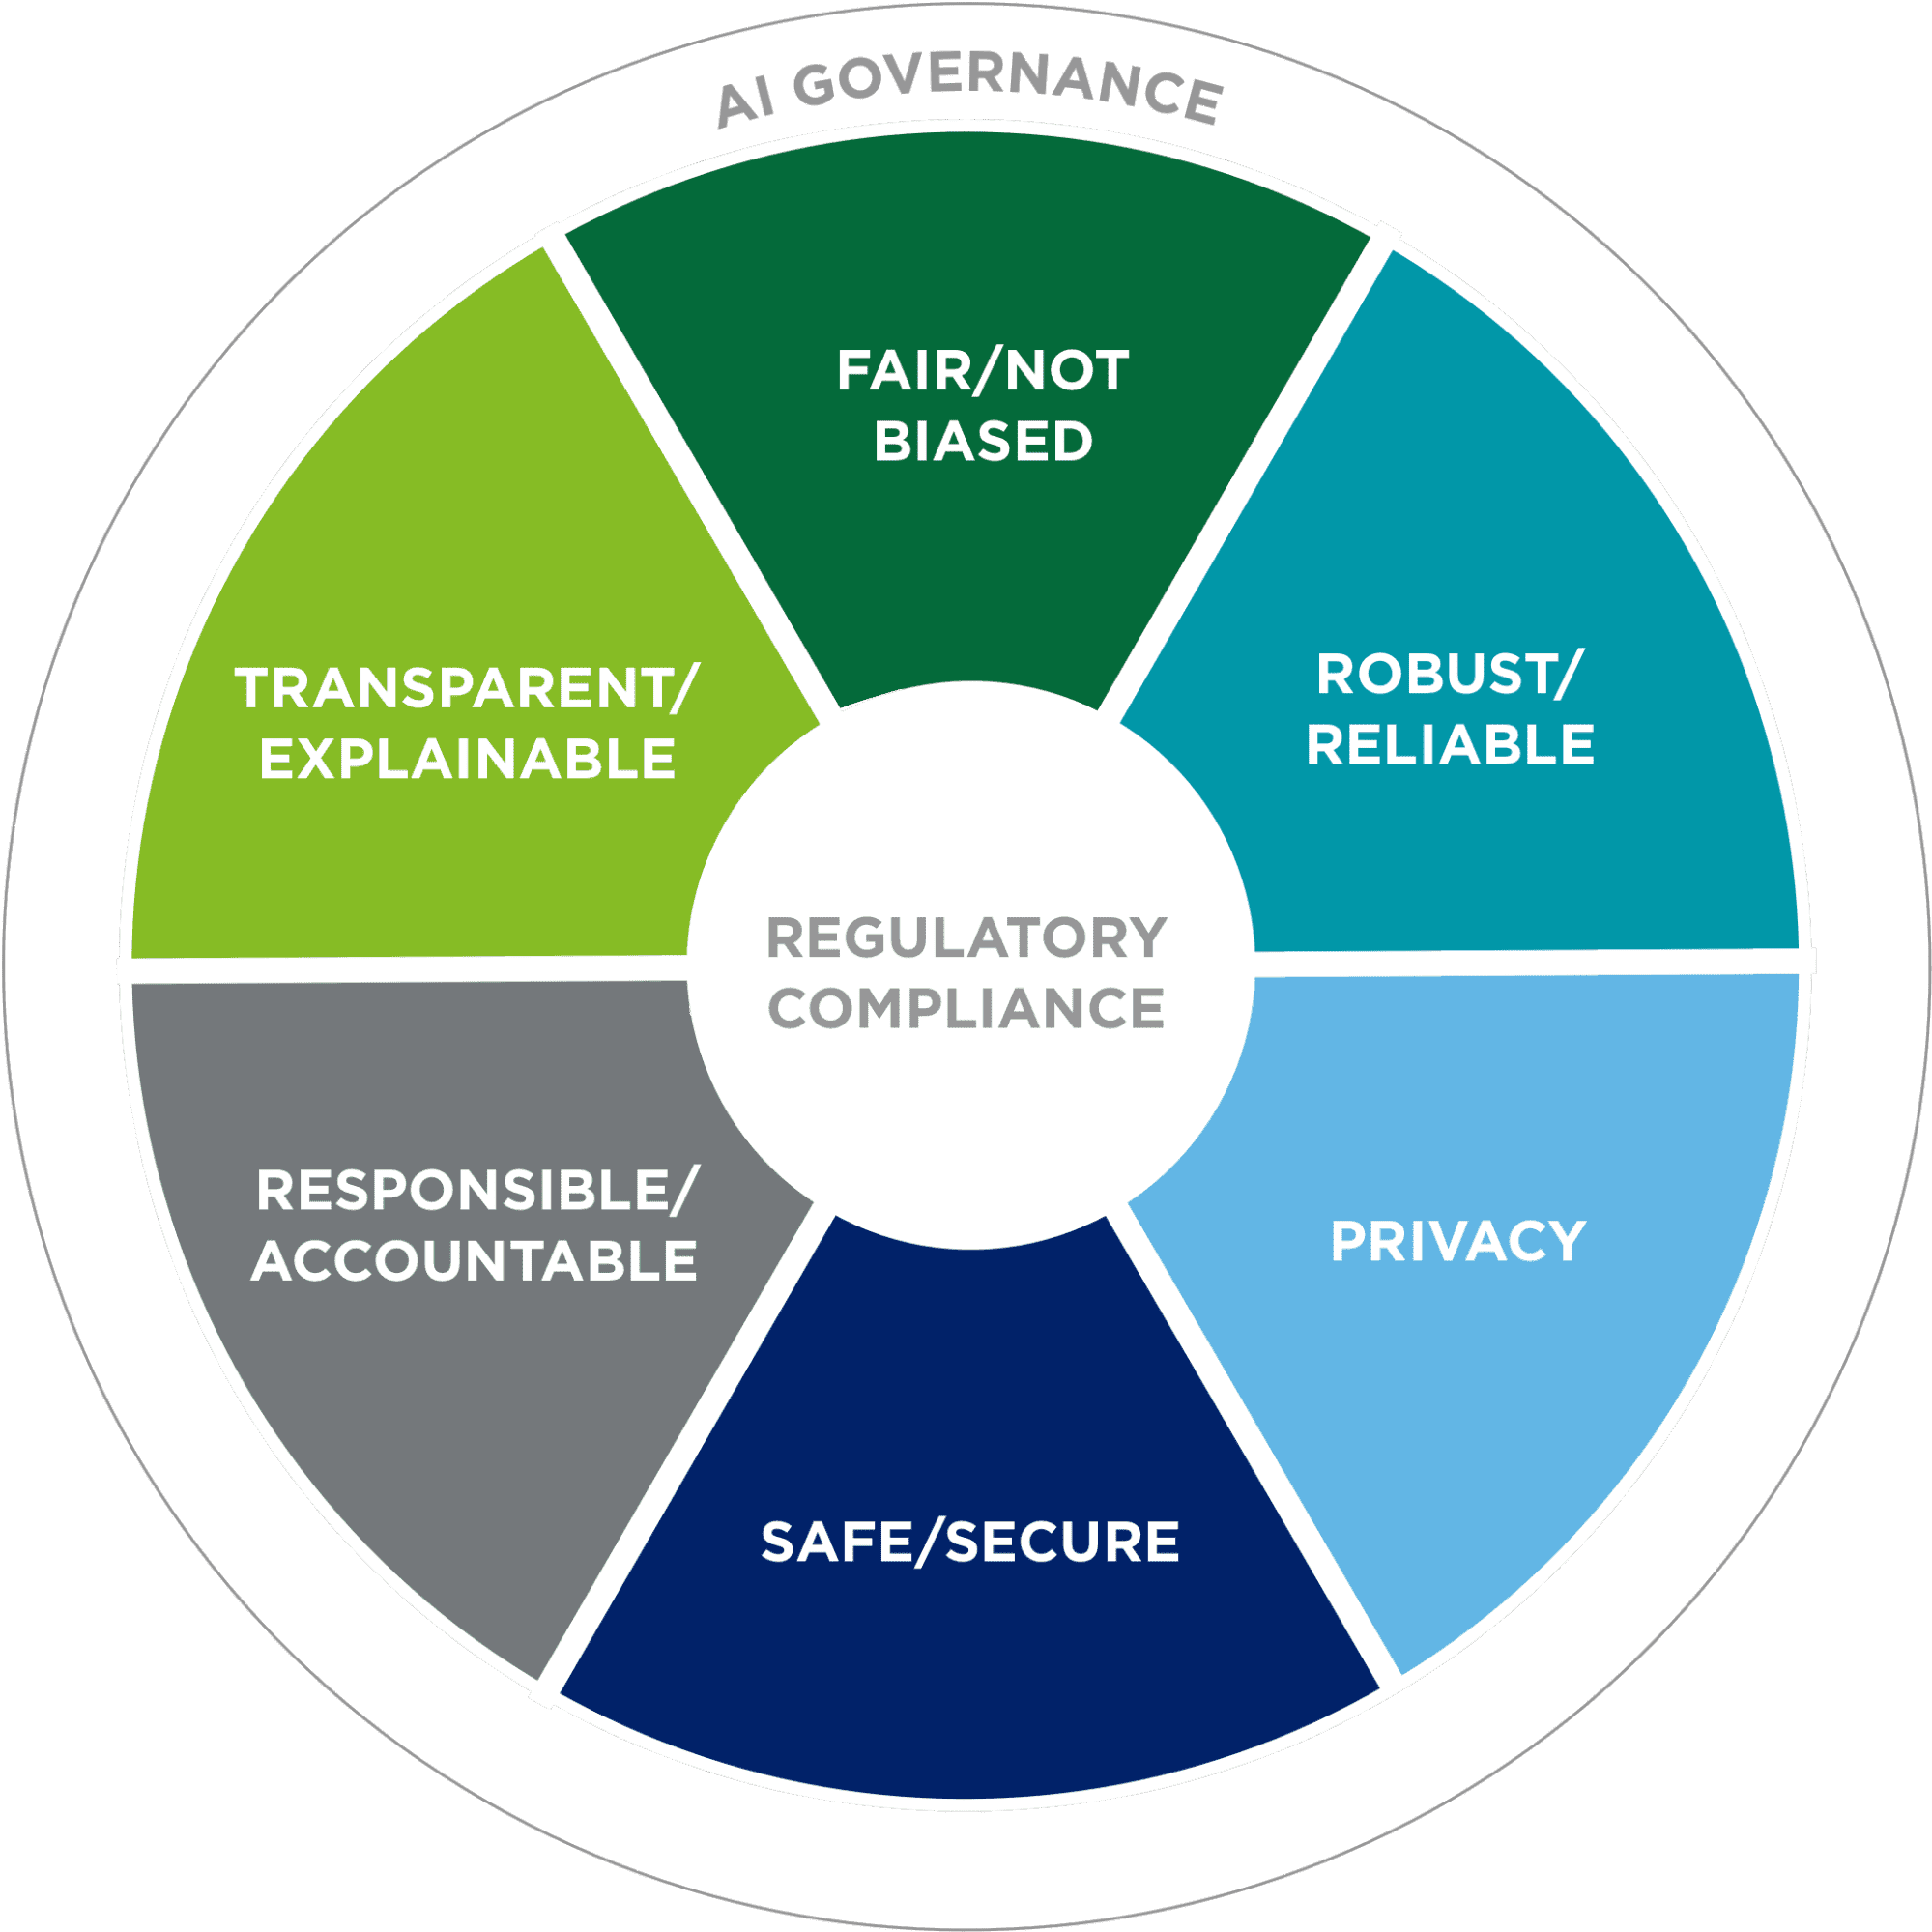
Data visualization value system & principles to abide by
Takeaways
- Know who the user is, what the business is & what they want.
- Understand what data is necessary & what is not.
- Know how to show the data in the simplest way possible.
- Know the brain’s biases & avoid complicating/confusing.
- Make it multi-sensorial, to reduce overload on eyes.
- Make sure data stands for truth, transparency & responsibility.
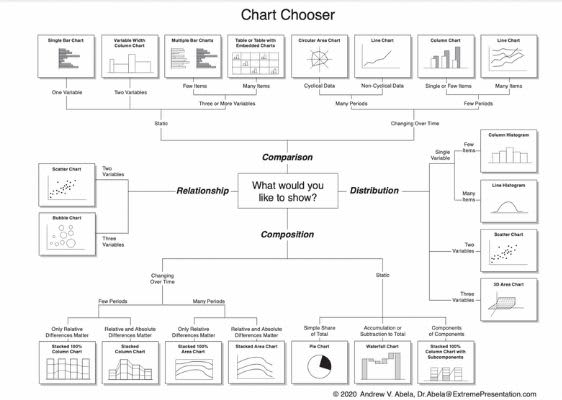
Free tool: Here’s a chart chooser.
Codewave was founded in 2013, to create an environment of radical transparency, empathy & peer power — helping individuals to go on a fearless adventure of knowing what to do when no one’s there telling what to do. We continue to be a living, social experiment open to individuals/families/societies/organizations finding self-sustainable alternatives to work. We’re thankful to everyone on our journey so far, to have shaped us to be who we are, stay true to our experiment and to who we aspire to become.
Frequently Asked Questions(FAQs)
What are the recent trends in data visualisation?
Designing data visualization solutions that are not manipulative/misleading by taking into account the human brain, biases, our ageing senses, and several other multisensorial design principles is a rising trend in the data visualization community.
What are data visualisation techniques?
Data visualization techniques are how you represent information and data for the analyst or end-users to consume. It’s an approach to graphically speak with the user. We make use of charts, plots, diagrams, matrices, and graphs to visualize the data. There are some popular tools like Tableu and Plotly that we can use to visualize data.
What are the key components of data visualization?
Tag clouds, summarization bars, pivot tables, maps and charts often comprises as the major components of any data visualization project.